Chapter 5: Monitoring with Amazon CloudWatch
Objectives
In this chapter, you will learn how to use Amazon CloudWatch to monitor the performance of containers running on ECS Fargate. Steps include:
- Monitor system metrics (CPU, memory, network)
- Create alarms
- Build visual dashboards
- (Optional) View logs for troubleshooting
1. Monitor metrics with CloudWatch Metrics
Steps:
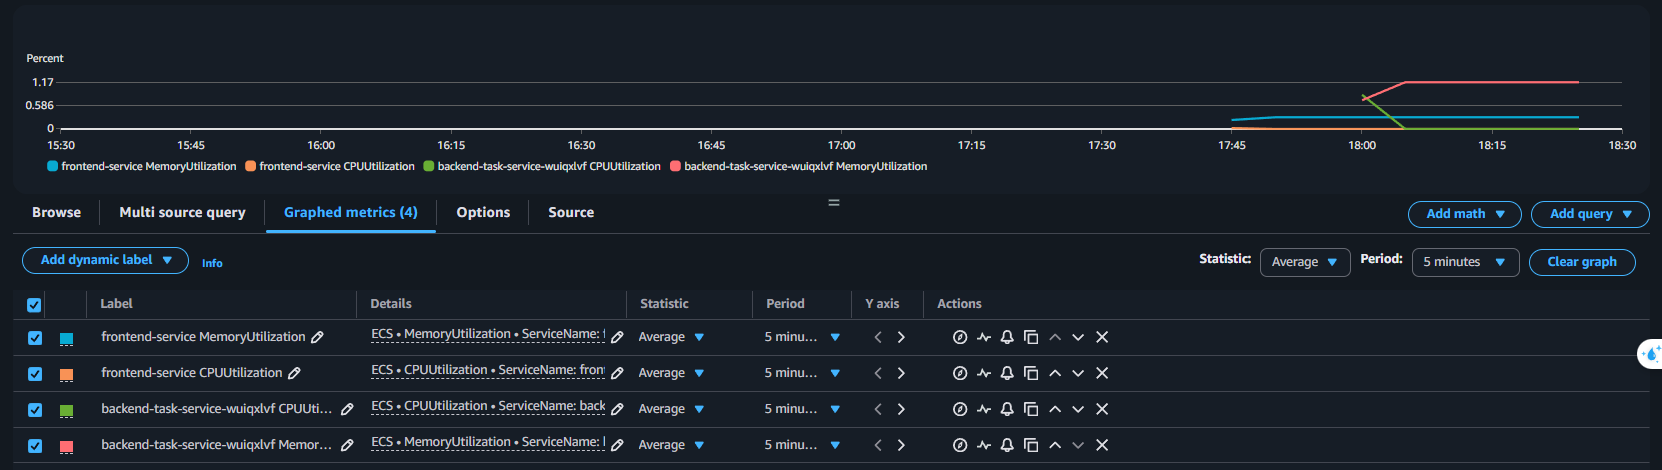
- Access AWS Console → CloudWatch → Metrics
- Find your ECS Cluster → select metrics to monitor:
| Metric | Meaning |
|---|---|
CPUUtilization |
CPU usage percentage |
MemoryUtilization |
Memory usage |
2. Create alerts with CloudWatch Alarm
Example: Alert when CPU > 80% for 5 minutes
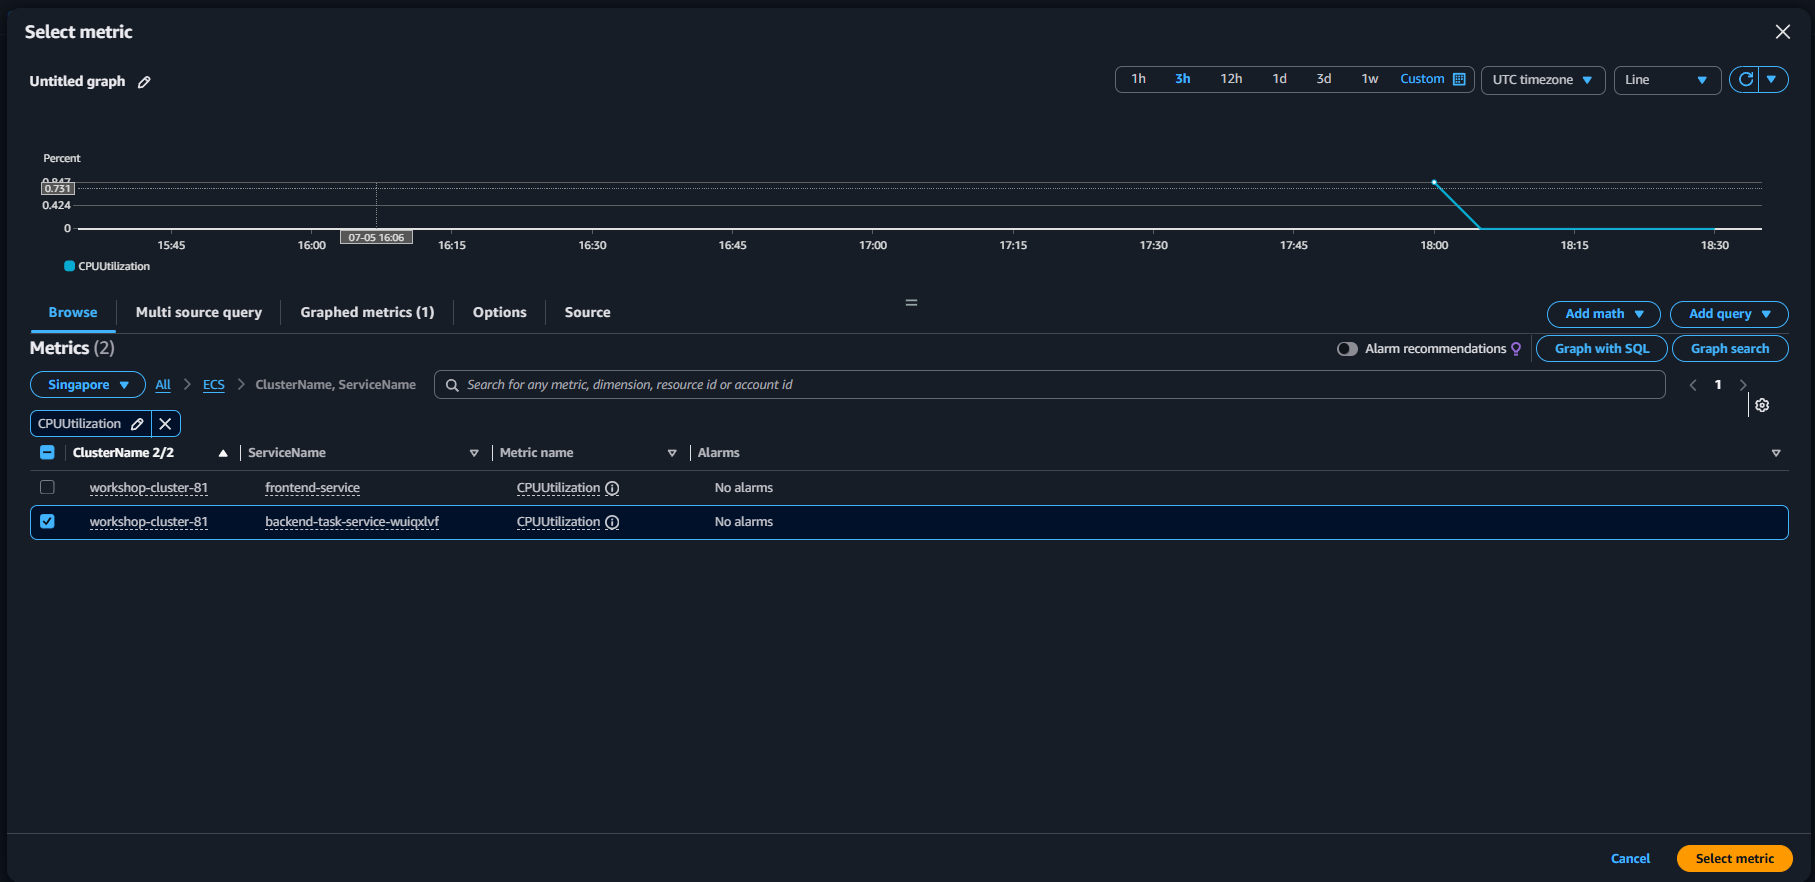
- Go to CloudWatch → Alarms → Create Alarm
- Select metric:
CPUUtilization - Select cluster → service to monitor
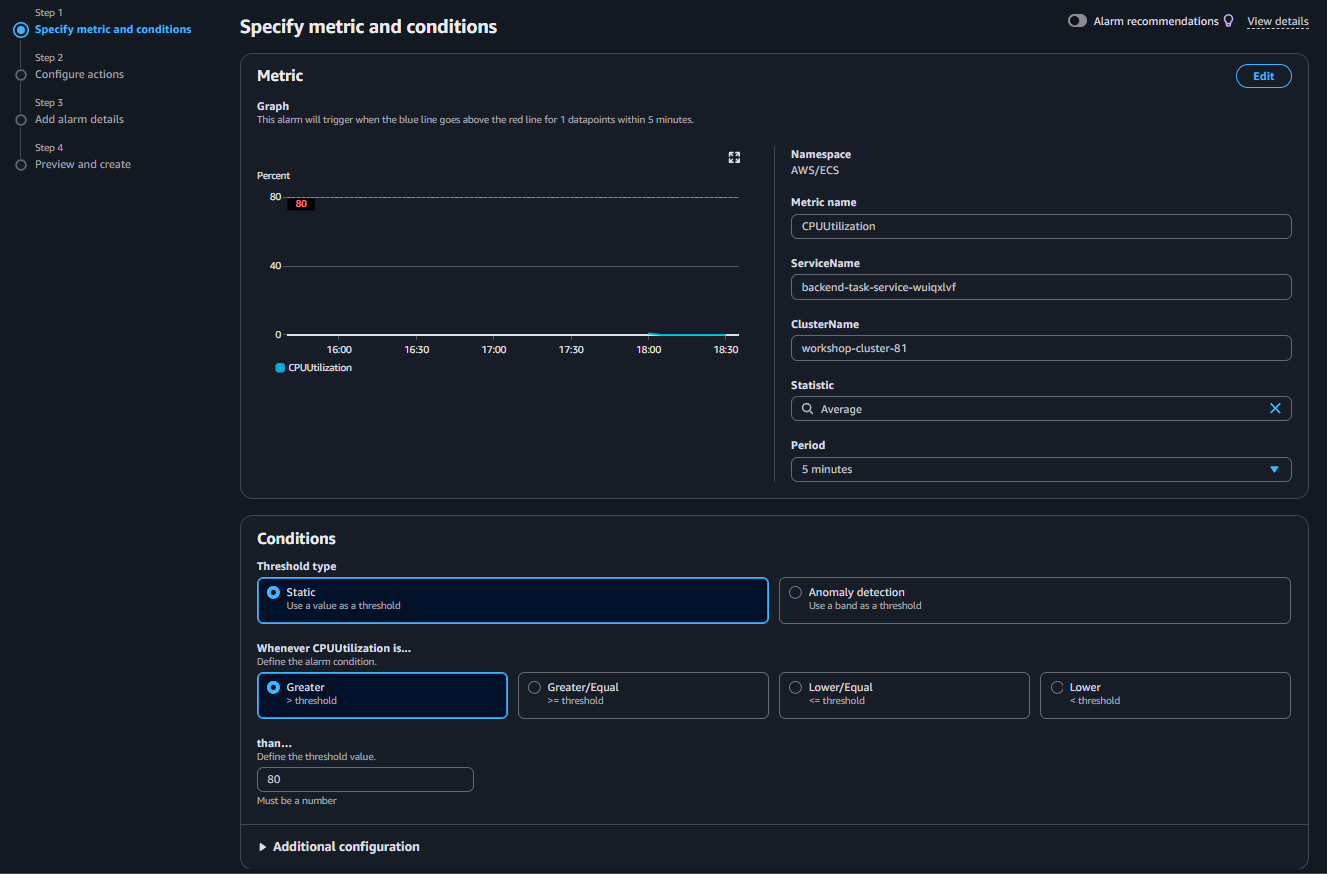
- Set conditions:
- Threshold:
Greater than 80 - Evaluation:
5 minutes
- Threshold:
- Optional: send alerts via SNS or email
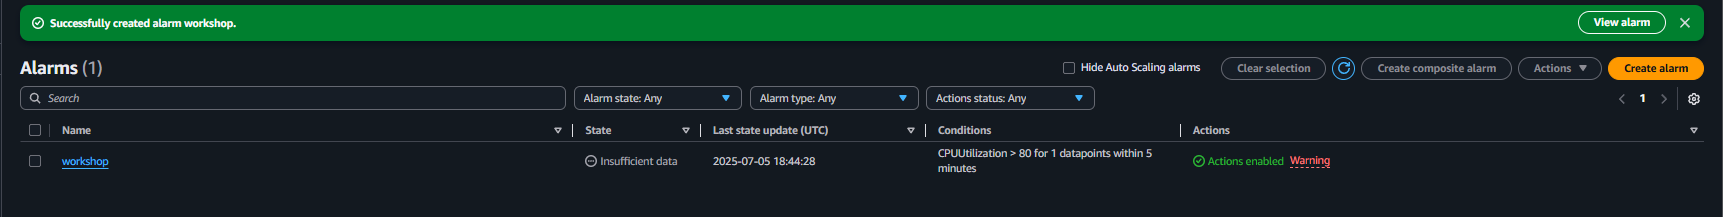
- Preview configuration → select “Create Alarm”
Tip: Create additional alarms for
MemoryUtilizationif you suspect memory leaks.
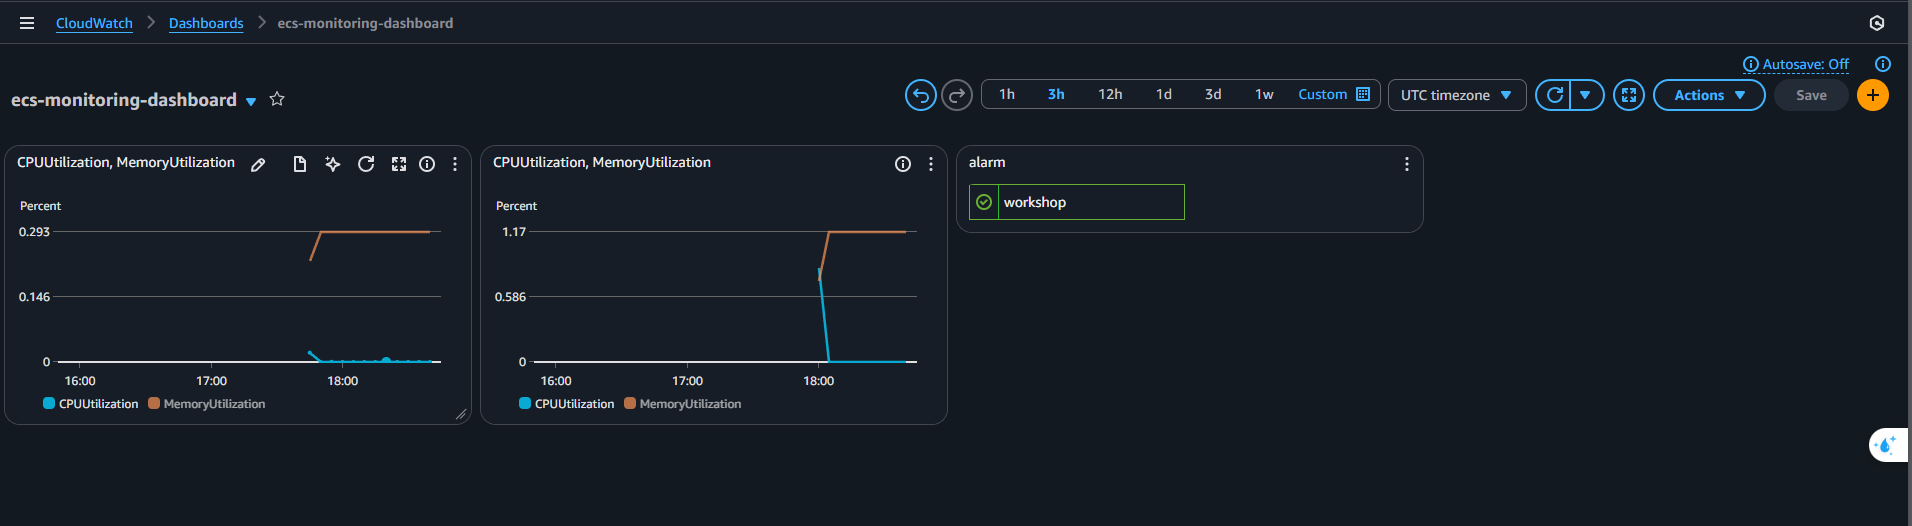
3. Create overall monitoring dashboard
- Go to CloudWatch → Dashboards → Create Dashboard
- Name example:
ecs-monitoring-dashboard - Add the following widgets:
| Widget | Type |
|---|---|
| CPUUtilization (FE + BE) | Line graph |
| MemoryUtilization | Line graph |
| Alarm status | Text or Alarm widget |
- Save and use for visual monitoring
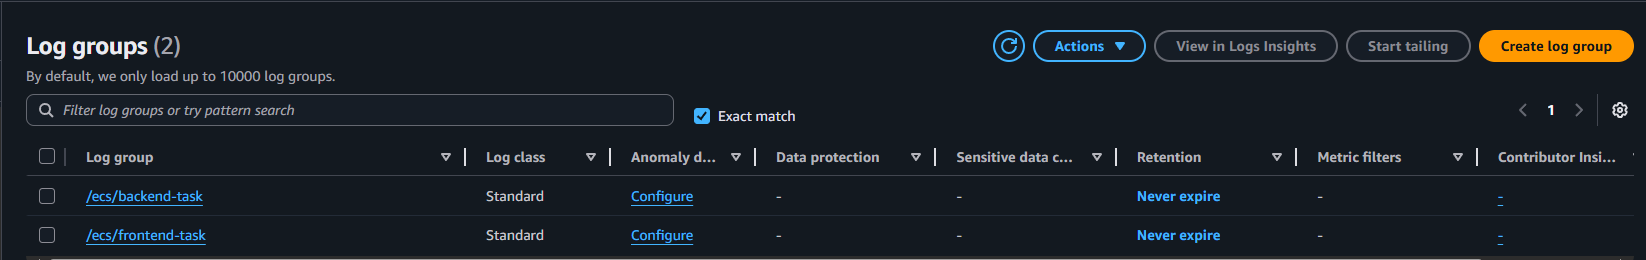
4. Check container logs
If you need to check errors:
- Go to CloudWatch → Logs → Log groups
- Select log groups to view
- Click latest log stream → view detailed logs
🔧 Log driver is configured by default in task definition from previous step.
Conclusion
Using CloudWatch helps you monitor, alert, and visualize ECS service performance. This is an essential DevOps tool to ensure applications run stably and respond promptly when issues occur.